
01
Graph Canvas
1 feature
Graph Canvas displays the companies, products, and investors in an ecosystem as connected points on a pan-and-zoom canvas, so you can explore how a market is structured and reposition the view to focus on any part of it.

Explore hub
GACompany-graph view of competitor GTM ecosystems · partners, channels, funding, events, signals.
What it is
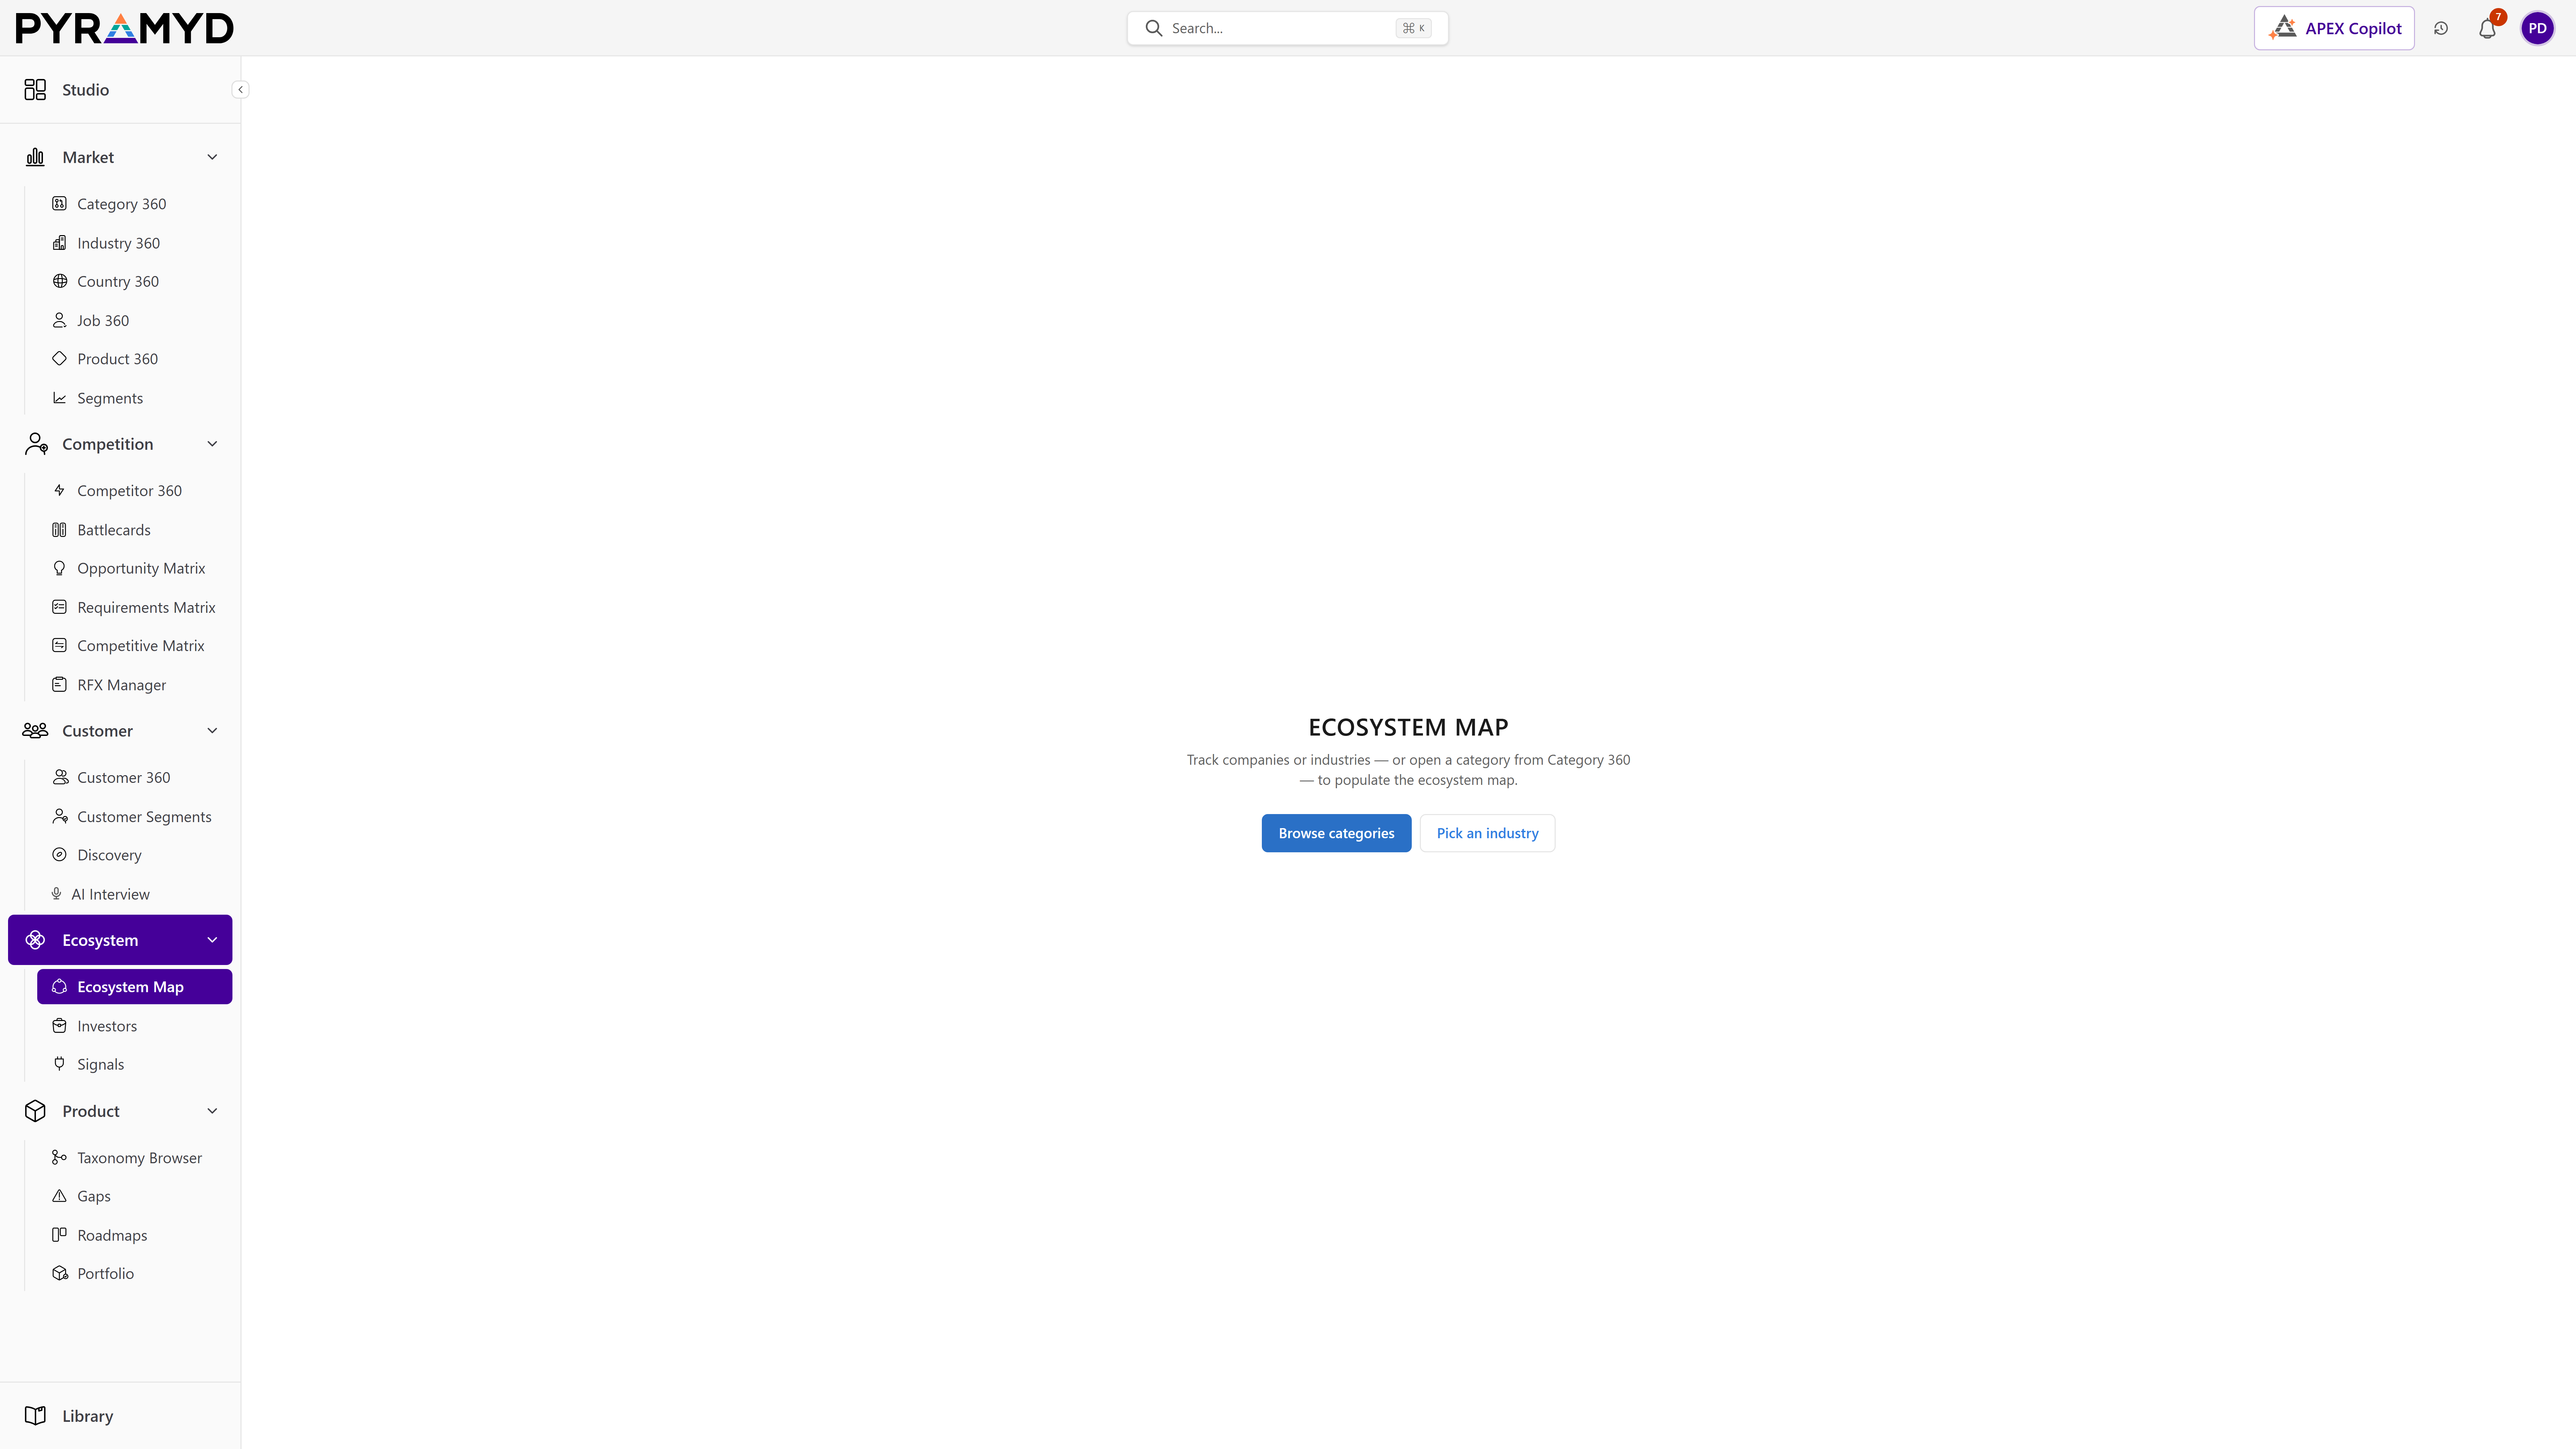
Ecosystem Map renders companies, products, investors, and the relationships between them as an interactive map of connected points. It brings together map navigation, profile inspection, and relationship exploration so you can see how a market connects and trace the links between its players.
See it in the product
Top 2 capabilities
Each capability is the parent of dozens of typed features in the production taxonomy. Hover any feature in Studio to drill into the underlying nodes.
1 feature
Graph Canvas displays the companies, products, and investors in an ecosystem as connected points on a pan-and-zoom canvas, so you can explore how a market is structured and reposition the view to focus on any part of it.
1 feature
Node Inspection opens a selected company, product, or investor to reveal its profile and direct connections, so you can move straight from the map into the detail behind any player.
More from the Explore hub

Investor-graph explorer. Per-investor 360 · portfolio, signals, theses.

163 sub-industries. Sector → group → industry → sub-industry. Live.

249 country markets. Region, sub-region, regulatory posture, demand signals.

2,606 software categories. Concentration, leaders, top products, refresh weekly.

251K+ branded products. Reviews, scores, releases, connectors, signals.

4,329 jobs across 28 modules. Software needs, decision makers, spend per seat.
30-minute walkthrough. We'll filter the workspace to your category and walk through the top capabilities live.