01
Volume
250K+ enterprise software products mapped across 2,546 live categories with 2.4M+ aggregated reviews.

The Data Foundation
The enterprise software market, already mapped and refreshable on demand — so the question that used to take an analyst a week takes your team a minute, and every answer arrives with the source attached.
Production slice · extracted 12 Aug 2026
18,586 nodes and 22,903 edges of the real graph — vendors, products, reviews, categories, and the links between them.
~7 MB · click any node, then show 1, 2 or 3 hops — loads on demand so this page stays fast
The enrichment pipeline
Each taxonomy node is enriched through the same 10 field groups in canonical tab order. Watch a single category fill in — every cell carries its model, its sources and a quality score.
Enrichment progress
100%
Filling Pulse …
Every taxonomy node (category, industry, country, job, product) carries the same 10 field groups in this canonical order. Same shape across taxonomies = one mental model for analysts, one API for connectors, one audit row per cell.
Enrichment on demand
The same runner powers every scope. You pick what to refresh, and every enrichment compounds back into the shared graph.
Taxonomy
1 of 5Every row in the table, every enrichable field. Held under an advisory lock, so only one bulk run is in flight at a time.
Row
2 of 5One node (e.g. one category, one country) refreshed across every enrichable field group.
Column
3 of 5One field on one node. Fields like founding year or a stock ticker resolve from a free public API instead of a model.
Group
4 of 5One of the 10 field groups (e.g. demand, landscape, compliance) refreshed on one node.
Cell
5 of 5One value inside a field on one node — the smallest unit, for fixing a single bad value.
Why it compounds
When a taxonomy row is enriched, the result lives in the shared product graph, so the next team that opens that category, country or role finds it already filled in. You pay only for the scope you run.
What you pay
Cell · 1 field, 1 row
One model call, or a free public-API lookup
Smallest
Row · 1 node, 10 groups
Every enrichable field, then the verification gate
One node
Taxonomy · every row
Advisory-locked: one bulk run at a time
Whole table
Runs are paid with the AI tokens on your plan (see Pricing) · the same verification gate applies to every scope.
Cell-level provenance, live in the workspace
A capture from the live app: the provenance popover shows how fresh the record is against its target, its quality, confidence and coverage, the sources behind it, and its history.
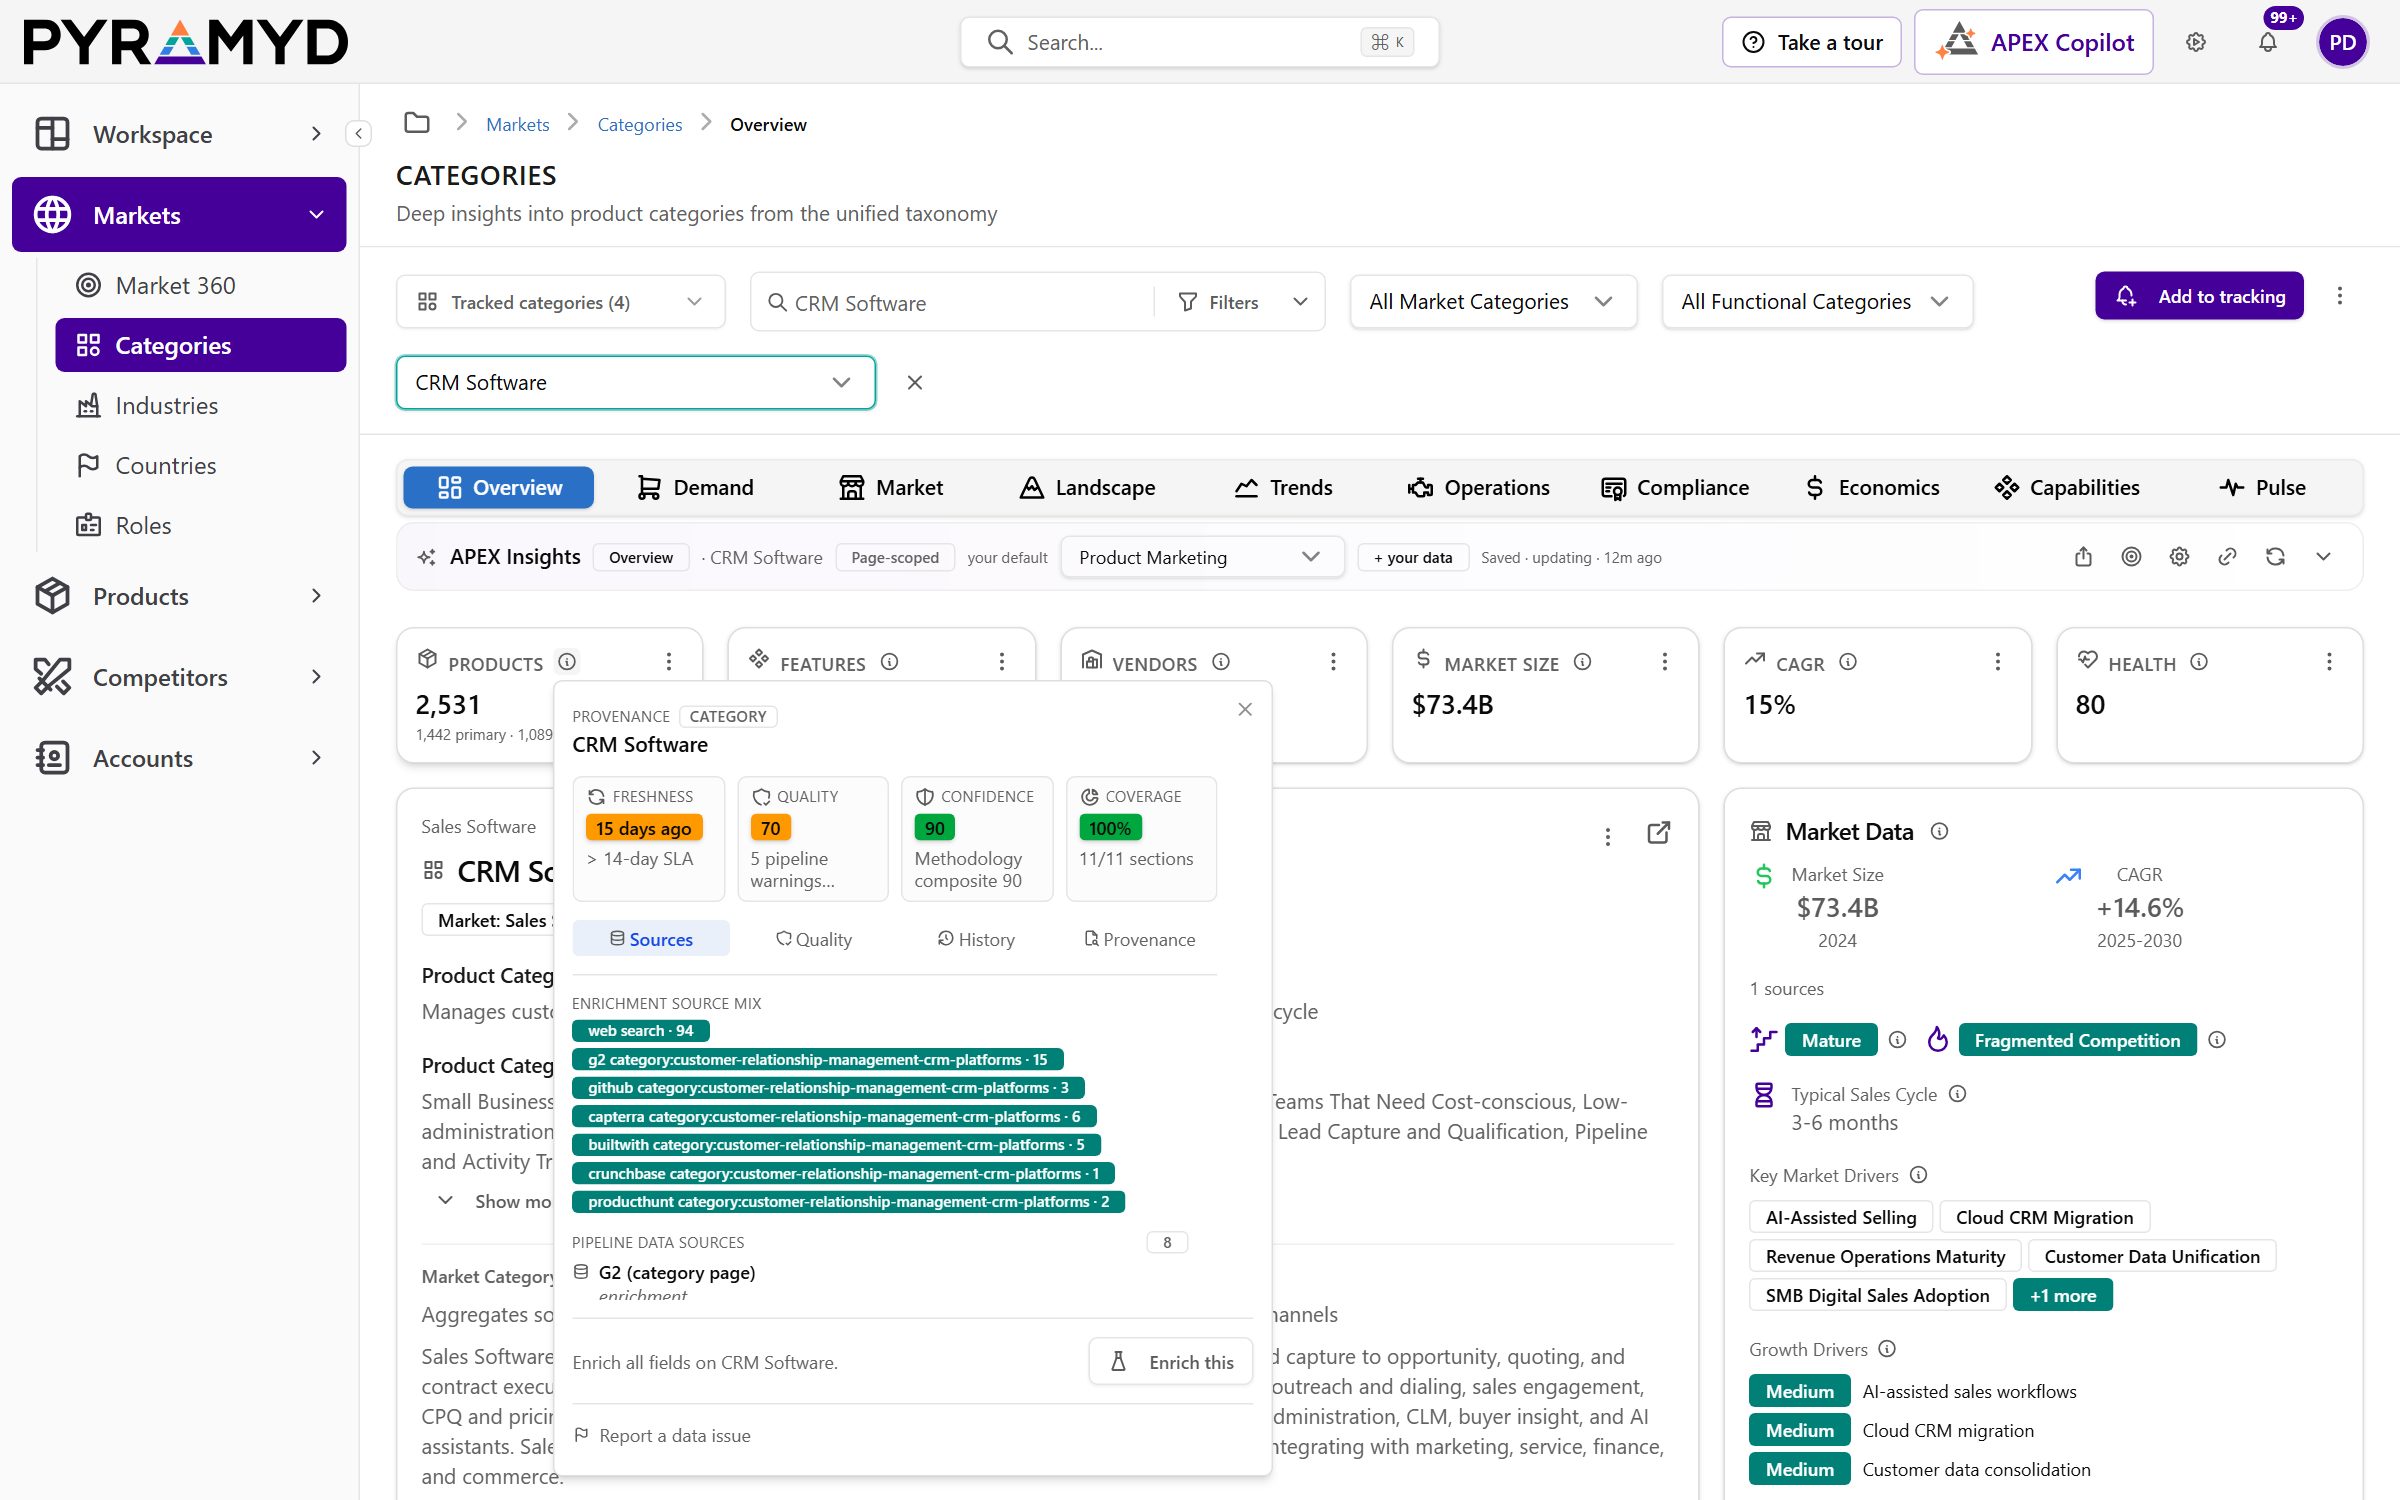
Captured from PYRAMYD's own workspace on 8 October 2026 · Markets › Categories, the CRM Software category, with its provenance popover open. The record is 15 days old, so its freshness shows past the 14-day target.
Freshness
How recently the field was verified against its source. Within SLA in this example — refreshed about 15 hours earlier.
Quality & Confidence
Quality is the underlying signal strength (65 here). Confidence is how sure the model is the extraction is correct. Both rendered as discrete scores, not heuristic stars.
Sources · Raw · History
Three tabs · Sources lists every URL fingerprinted into the field, Raw shows the model's captured payload byte-for-byte, History is the audit log of every previous value.
What's in the graph
A real record from the production graph, read on 8 October 2026: the Salesforce company node and two of its products. Scores are on the 0–100 scale.
Company node · as stored
{
  "uuid": "498ff126-ced2-416c-9422-87c8e511ae57",
  "company_name": "Salesforce",
  "slug": "salesforce",
  "year_founded": 1999,
  "headquarters": { "city": "San Francisco", "state": "CA" },
  "country": "USA",
  "website_url": "https://www.salesforce.com",
  "provenance": {
    "ein": {
      "model": "gpt-5.6-luna",
      "quality": { "pass": true, "score": 100,
        "scored_at": "2026-10-07T17:59:58Z" }
    }
  }
}
Linked to it: 101 product nodes, 23,384 review nodes and 74 categories (its products show 214,229 reviews on the review sites). Every enriched field records the model that wrote it and the quality score it passed.
Two of its 101 products
{
  "company": "Salesforce",
  "products": [
    { "product_name": "Salesforce Sales Cloud",
      "product_review_score": 88,
      "review_count": 25877,
      "category": "CRM Software" },
    { "product_name": "Salesforce Service Cloud",
      "product_review_score": 88,
      "review_count": 7997,
      "category": "Help Desk Software" }
  ],
  "top_categories_by_reviews": [
    "Work Management Software",
    "CRM Software",
    "Cloud Platform as a Service (PaaS)",
    "Marketing Automation Software"
  ]
}
Coming soon: any agent (Claude, ChatGPT, GitHub Copilot or your own model) will query the graph through our MCP server, with answers that come back typed, cited and traversable.
The Six Layers
Each layer reinforces the others. Together they form a foundation that gets deeper with every refresh · not narrower.


250K+ products and 2.4M+ reviews already in one graph.
Depth × Breadth
Every taxonomy carries the same 10 field-group schema — overview, pulse, demand, market, landscape, trends, economics, operations, compliance, capabilities. Multiply row count × column width × 10 dimensions and the foundation is structured, not just big.
| Node | Rows | Cols | Fields (rows × cols) | Refresh |
|---|---|---|---|---|
| Products | 250,632 | 316 | 79.2M | On demand · per source |
| Reviews | 2,455,618 | 118 | 289.8M | On demand · major review platforms |
| Vendor features | 2,334,225 | 290 | 676.9M | On demand · vendor changelogs |
| Companies | 1,436,837 | 314 | 451.2M | On demand · funding + hiring |
| Contacts | 3,383,472 | 126 | 426.3M | On demand · roles + moves |
| Categories | 2,546 | 212 | 539,752 | On demand · LLM-enriched |
| Industries | 463 | 118 | 54,634 | On demand · LLM-enriched |
| Countries | 249 | 101 | 25,149 | On demand · regulator-tracked |
| Roles | 4,349 | 86 | 374,014 | On demand · LLM-enriched |
| Total | ~9.9M | across 9 node types | ~1.9B fields (rows × columns) | On demand |
Enrichment coverage
Each enriched row records the model and the time of its run; category rows also keep the web citations that were found. Counts come from the production database.
Categories
100%
2,539 of 2,546 rows enriched
1 model
last enriched: 2026-06-19
Industries
100%
463 of 463 rows enriched
1 model
last enriched: 2026-08-13
Countries
100%
249 of 249 rows enriched
2 models
last enriched: 2026-08-14
Roles
100%
4,329 of 4,349 rows enriched
5 models
last enriched: 2026-06-18
Refresh on demand
Categories, industries, countries, roles, products and reviews can each be re-enriched from the workspace when you need them; token consumption applies.
Refresh on demand · products
The compounding foundation
Refresh a node, or one field group across the rows you pick, when you need it. Battlecards, dashboards and APEX answers then carry the evidence from the latest refresh.
On demand
Any node, when you ask · token usage applies
Row or group
One node, or one field group across rows
2,000+
Signal sources in the catalog, picked per watchlist
On demand
User-triggered · any node
Need fresher data right now? Hit refresh on any node from the workspace to queue a fresh enrichment run. Token consumption applies per re-enriched row, billed against your workspace budget.
Signals
Every refresh brings them in
Review feeds, competitor website diffs, funding announcements, hiring signals and press wires come in each time their sources are refreshed, then surface in Competitor 360 and Alerts.
Why this matters
Every node carries a verified-at timestamp. When a review changes, a category shifts, or a competitor ships a price change, any analyst can rebuild the battlecard or force an instant refresh on the rows that matter most this morning, with provenance preserved on every cited claim.
Live Today
These aren't roadmap numbers. Every figure here is queryable on the platform today.
250K+
Enterprise software products tracked across 2,546 categories
2.4M+
Aggregated software reviews from the major review platforms
2000+
Signal sources in the catalog, selectable per watchlist
91
Universal node types across the entire graph schema
431
Edge types, each one checked by the database
3.08×
Live query speedup vs. baseline (2,519ms → 818ms)
91 Universal Node Types
The graph schema is the foundation. Ten categories span people, nodes, products, revenue, finance, operations, comms, content, data, and systems — and every edge between them is a query the graph can answer.
People
Contacts · roles · positions · interviews
Nodes
Companies · teams · workspaces · segments · locations · countries · industries
Products
Products · categories · features · releases · reviews
Revenue
Deals · evaluations · orders · pipelines · subscriptions · contracts · campaigns · cadences · battlecards · assessments
Finance
Transactions · postings · ledgers · periods · budgets · forecasts · filings
Operations
Ideas · requirements · issues · projects · roadmaps · cycles · objectives · capabilities · processes
Comms
Communications · chats · channels · events
Content
Documents · discussions · articles · snippets · sheets · slides · notebooks · canvases · forms · files · folders · transcripts
Data
Datasets · catalogs · connectors · transformations · prompts · agents · runs · models · experiments · metrics · signals · dashboards
Systems
Repositories · branches · commits · credentials · settings · activities · devices · alerts · applications · policies · services
Every Signal Cited
Enriched records carry source, time, model and confidence where they were produced by a run.

Every signal links back to the real source — a press release, a review, a vendor changelog, a regulatory filing.

When the signal was captured. When it was last re-verified. When the source itself was updated.

Which model wrote the enrichment, which prompt, and a confidence score per field.

Every enriched row is scored by a rule-based audit before it is used.
When a customer asks "where did this come from?" they have a defensible, regulator-ready answer.
In 30 minutes we'll pull live data for your top 5 competitors, walk the graph, and show APEX answer a multi-hop question with every citation traceable to source.
250K+ products are not the moat. The 9.6 million links in the graph are — edges are what let the engine predict, not just retrieve.
Where do you want to take this?
Product marketing
Positioning, launches and battlecards that hold up.
Explore
Competitive & market intelligence
Catch every move and brief the company on it.
Explore
Strategy & corporate development
Choose where to compete next, with sources.
Explore
Product management & operations
Decide what to build with the market in the room.
Explore
Sales operations & RevOps
Target lists, territories and a pipeline you can plan from.
Explore
Sales & enablement
Battlecards, comparisons and RFP answers in the deal.
Explore
Customer success & accounts
See churn coming while you can still stop it.
Explore
AI & data teams
Notebooks, models and agents on the graph.
Explore