
PYRAMYD
Solutions

Explore hub

GA

Industry Taxonomy

Every sub-industry showing the software categories that actually serve it, ranked by demand share — 8,701 industry-to-category links, no LLM guesswork.

4 top capabilities463 featuresIn the Product Graph

What it is

Industry Taxonomy.

Every sub-industry showing the software categories that actually serve it, ranked by demand share — 8,701 industry-to-category links, no LLM guesswork.

See it in the product

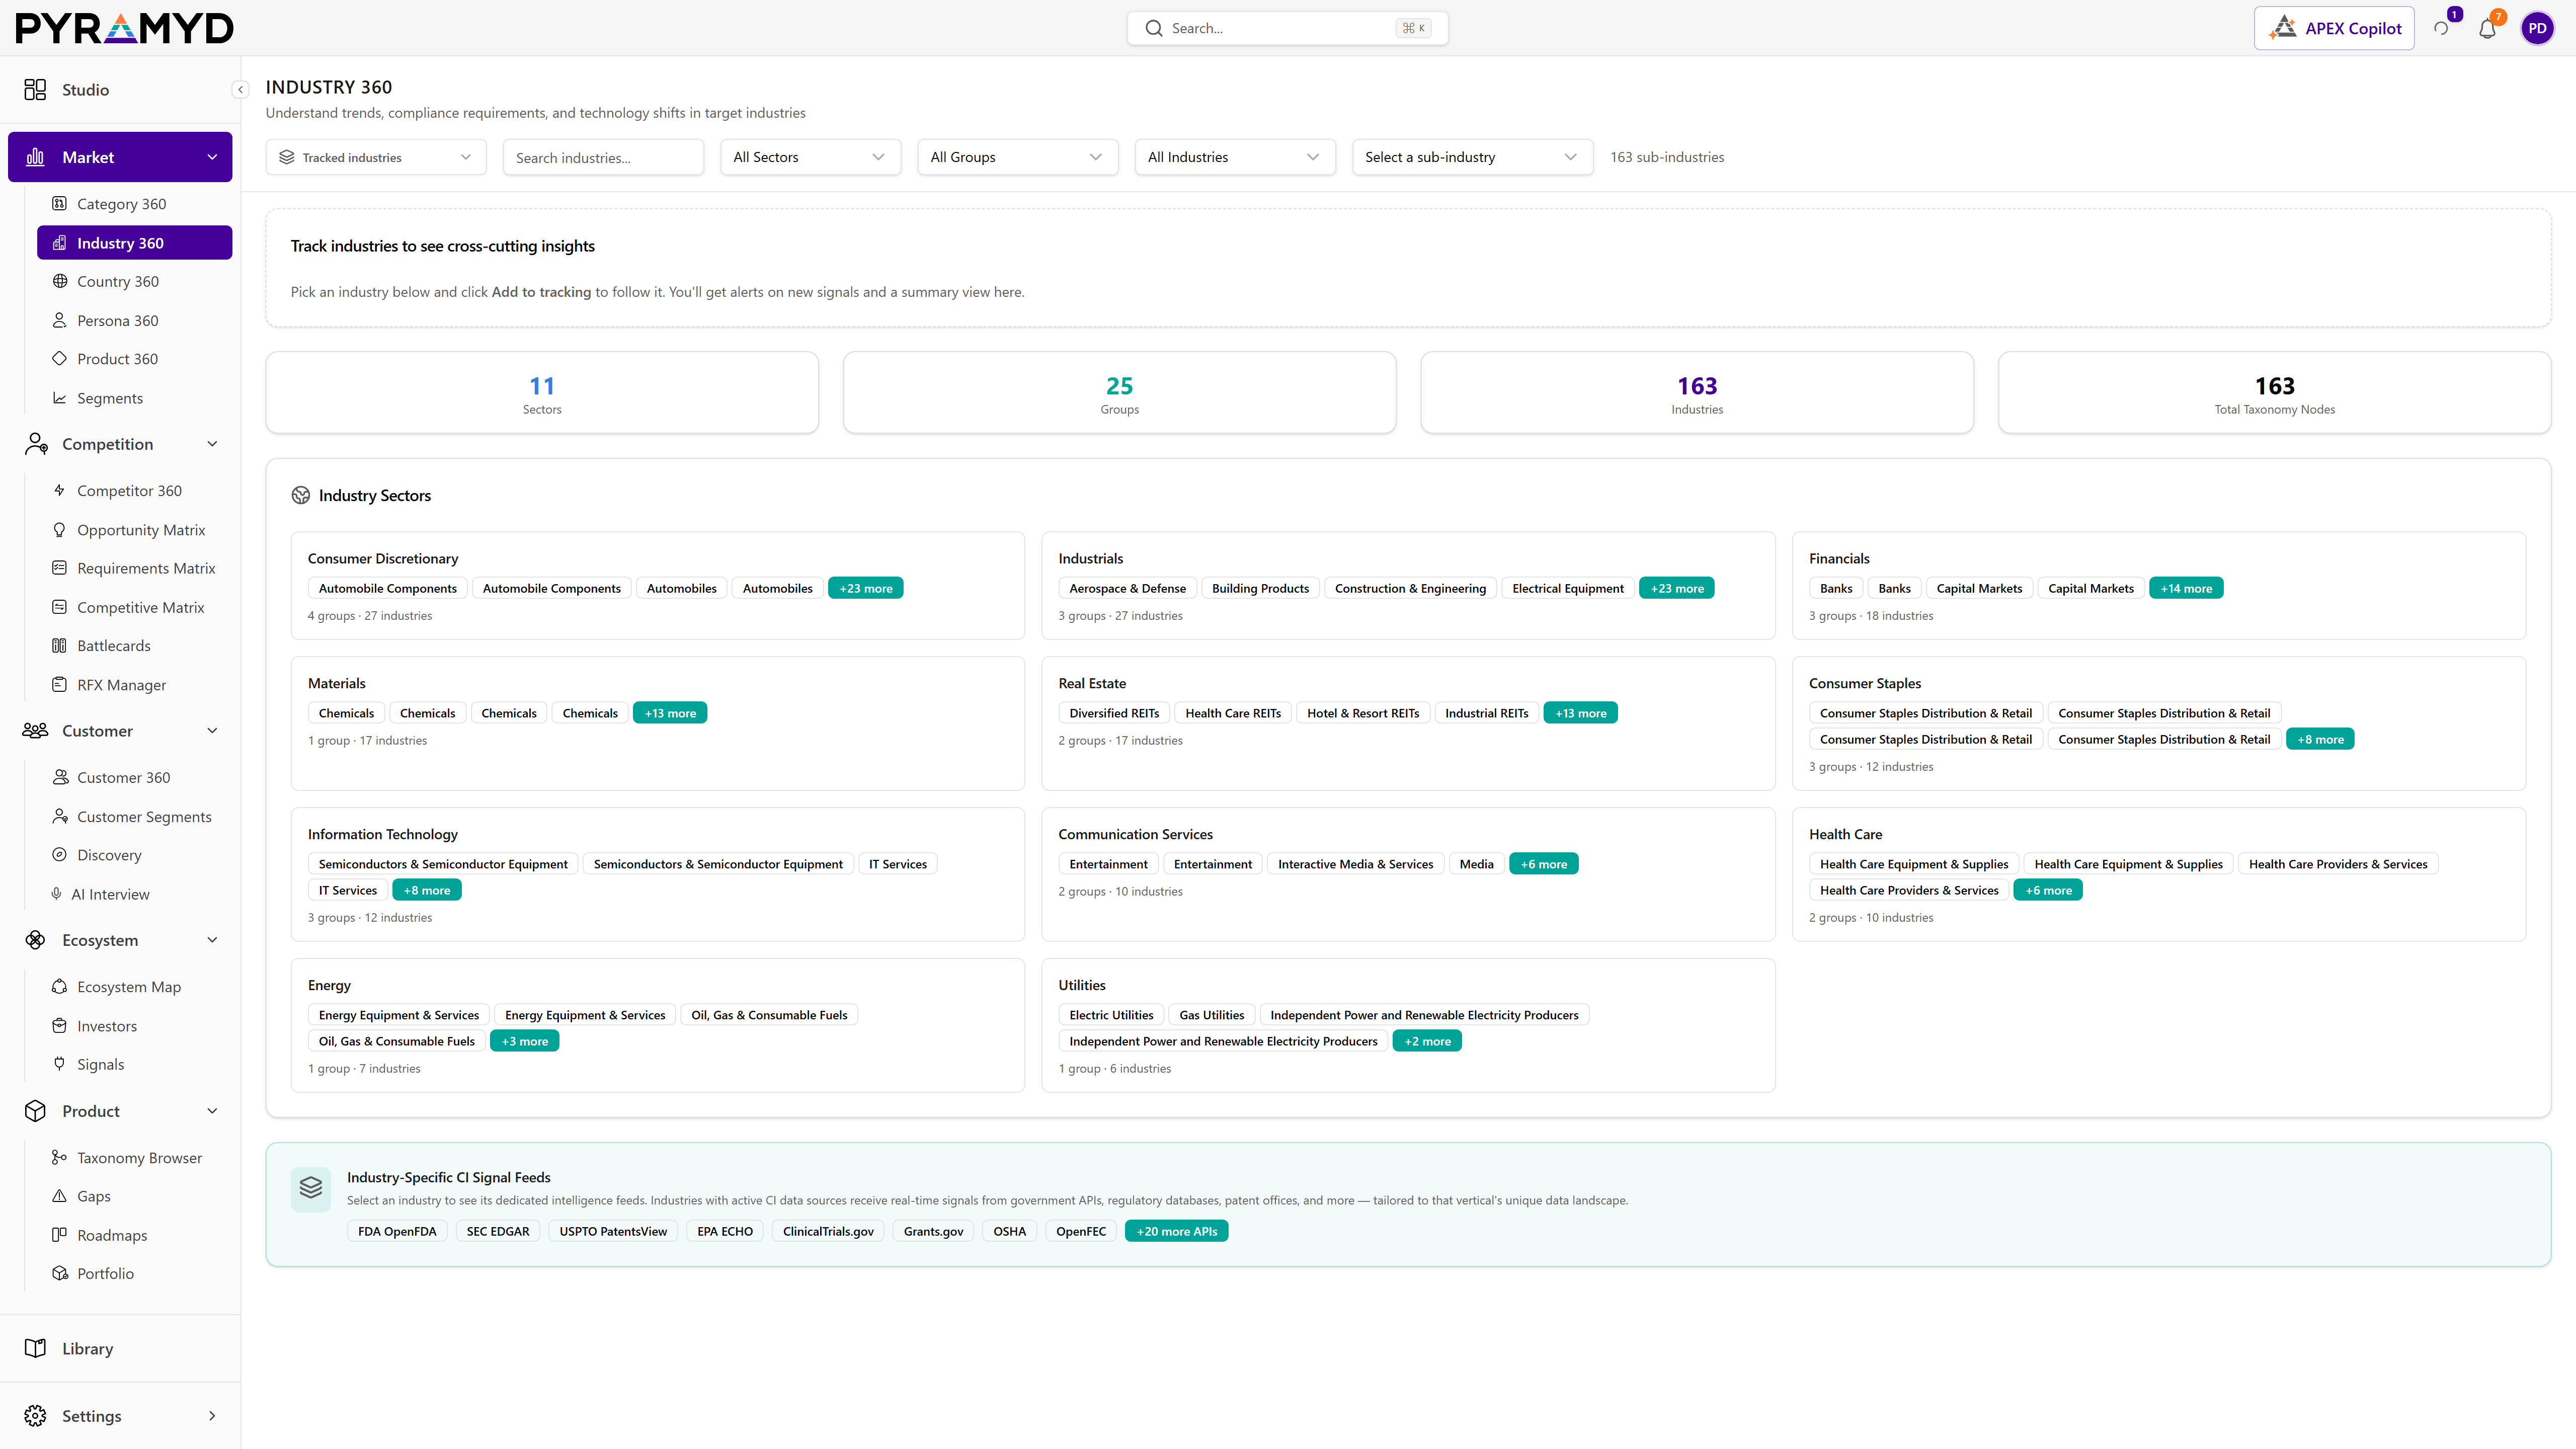
Industry Taxonomy in the workspace.

Industry Taxonomy screenshot from the production workspace

Top 4 capabilities

The most impactful capabilities.

Each capability is the parent of dozens of typed features in the production taxonomy. Hover any feature in Studio to drill into the underlying nodes.

01

22-sector / 258-industry / 463-sub-industry hierarchy navigation

463 features

Drill from GICS-aligned sector down through industry group, industry, and sub-industry. Every node in the graph (vendor, job, signal) inherits up the hierarchy so you can filter by sector and pick up the long-tail sub-industries automatically.

02

Software spend per employee benchmarking

Per-industry IT spend benchmarks drawn from public filings, vendor disclosures, and aggregated procurement signals. Compare your spend ratio against industry medians and quartiles.

03

Top software categories by industry

Each industry maps to a ranked list of the software categories that dominate spend in that sector · refreshed daily from the live category_taxonomy graph.

04

Market leaders + innovation leaders per industry

Two ranked vendor lists per industry: the entrenched share leaders and the rising-revenue innovation leaders. Powered by review velocity, funding signals, and category-momentum scoring.

See Industry Taxonomy running against your category.

30-minute walkthrough. We'll filter the workspace to your category and walk through the top capabilities live.