Only strictly necessary cookies until you opt in — see our Strictly necessary cookies run the site. With your consent we also use functional, analytics, and marketing cookies — nothing non-essential loads until you opt in. See our Cookie Policy.
Open a record for any software product in the Product Graph: its score on eight dimensions with the evidence and confidence behind each, what reviewers say by segment, what it connects to, and its latest news.
Narrated walkthrough, about 71 seconds. Turn on narration to hear it; the captions on the board carry the same words.
Read the six steps
Pick a product. Pick any product in the Product Graph, here MicroStrategy Analytics, and its Product 360 opens on ten tabs, from Overview to Pulse.
What it reads. It reads eight inputs: review-site scores, individual reviews, the feature matrix, pricing and plans, integrations and API, status pages, release signals, and category peers.
What buyers say. A strip of six numbers shows what buyers say: an overall score of 83 from the review sites, then reviews, features, integrations, ease of use, and value.
Eight spokes, one score. Eight spokes score it from 0 to 100, with Capabilities, built from feature scores, weighted most. Its APEX score is 72, at the 80th percentile of its category.
Where it stands. The Overview then places it in its category: a SWOT built by fixed rules from its ratings and counts, its rank, and its top competitors.
Pulse and export. Pulse lists the latest news and signals, sorted by importance. Export the record as a PowerPoint deck or a PDF, or share a read-only link that expires in 90 days.
What teams do with Product 360
Four jobs, four real use cases
1
Size up a rival’s product before the pricing review
Product manager · Product
Acme is pricing a new tier, and the product manager needs the rival’s product in front of the team before Thursday’s pricing review.
Open your own product’s Product 360.
Type the rival’s product name in the switcher to jump to its record.
Read its scores, the evidence behind them, and its news on one page.
Export the rival’s 360 for the pricing review.
One record per product
Scores with their evidence
Export and share
250,583 live products to open, 142,881 with a stored score board · production counts, 3 Nov 2026
Before briefing Northwind’s healthcare sellers, the analyst needs to show where the rival is strong or weak for buyers in that industry, and how sure each score is.
Open the rival’s Product 360 on Overview.
Read its score on each of the eight dimensions, with the evidence and confidence behind each.
Switch the lens to Healthcare and see how its Fit changes.
Where a dimension reads “Not assessed”, say so in the brief instead of guessing.
Eight dimensions on one card
Evidence and confidence per score
Fit for your industry or role
“Not assessed” where evidence is missing
142,881 products carry an eight-dimension board, 61,132 of them scored on at least one dimension; 51,015 have an Experience score from customer reviews · production counts, 3 Nov 2026
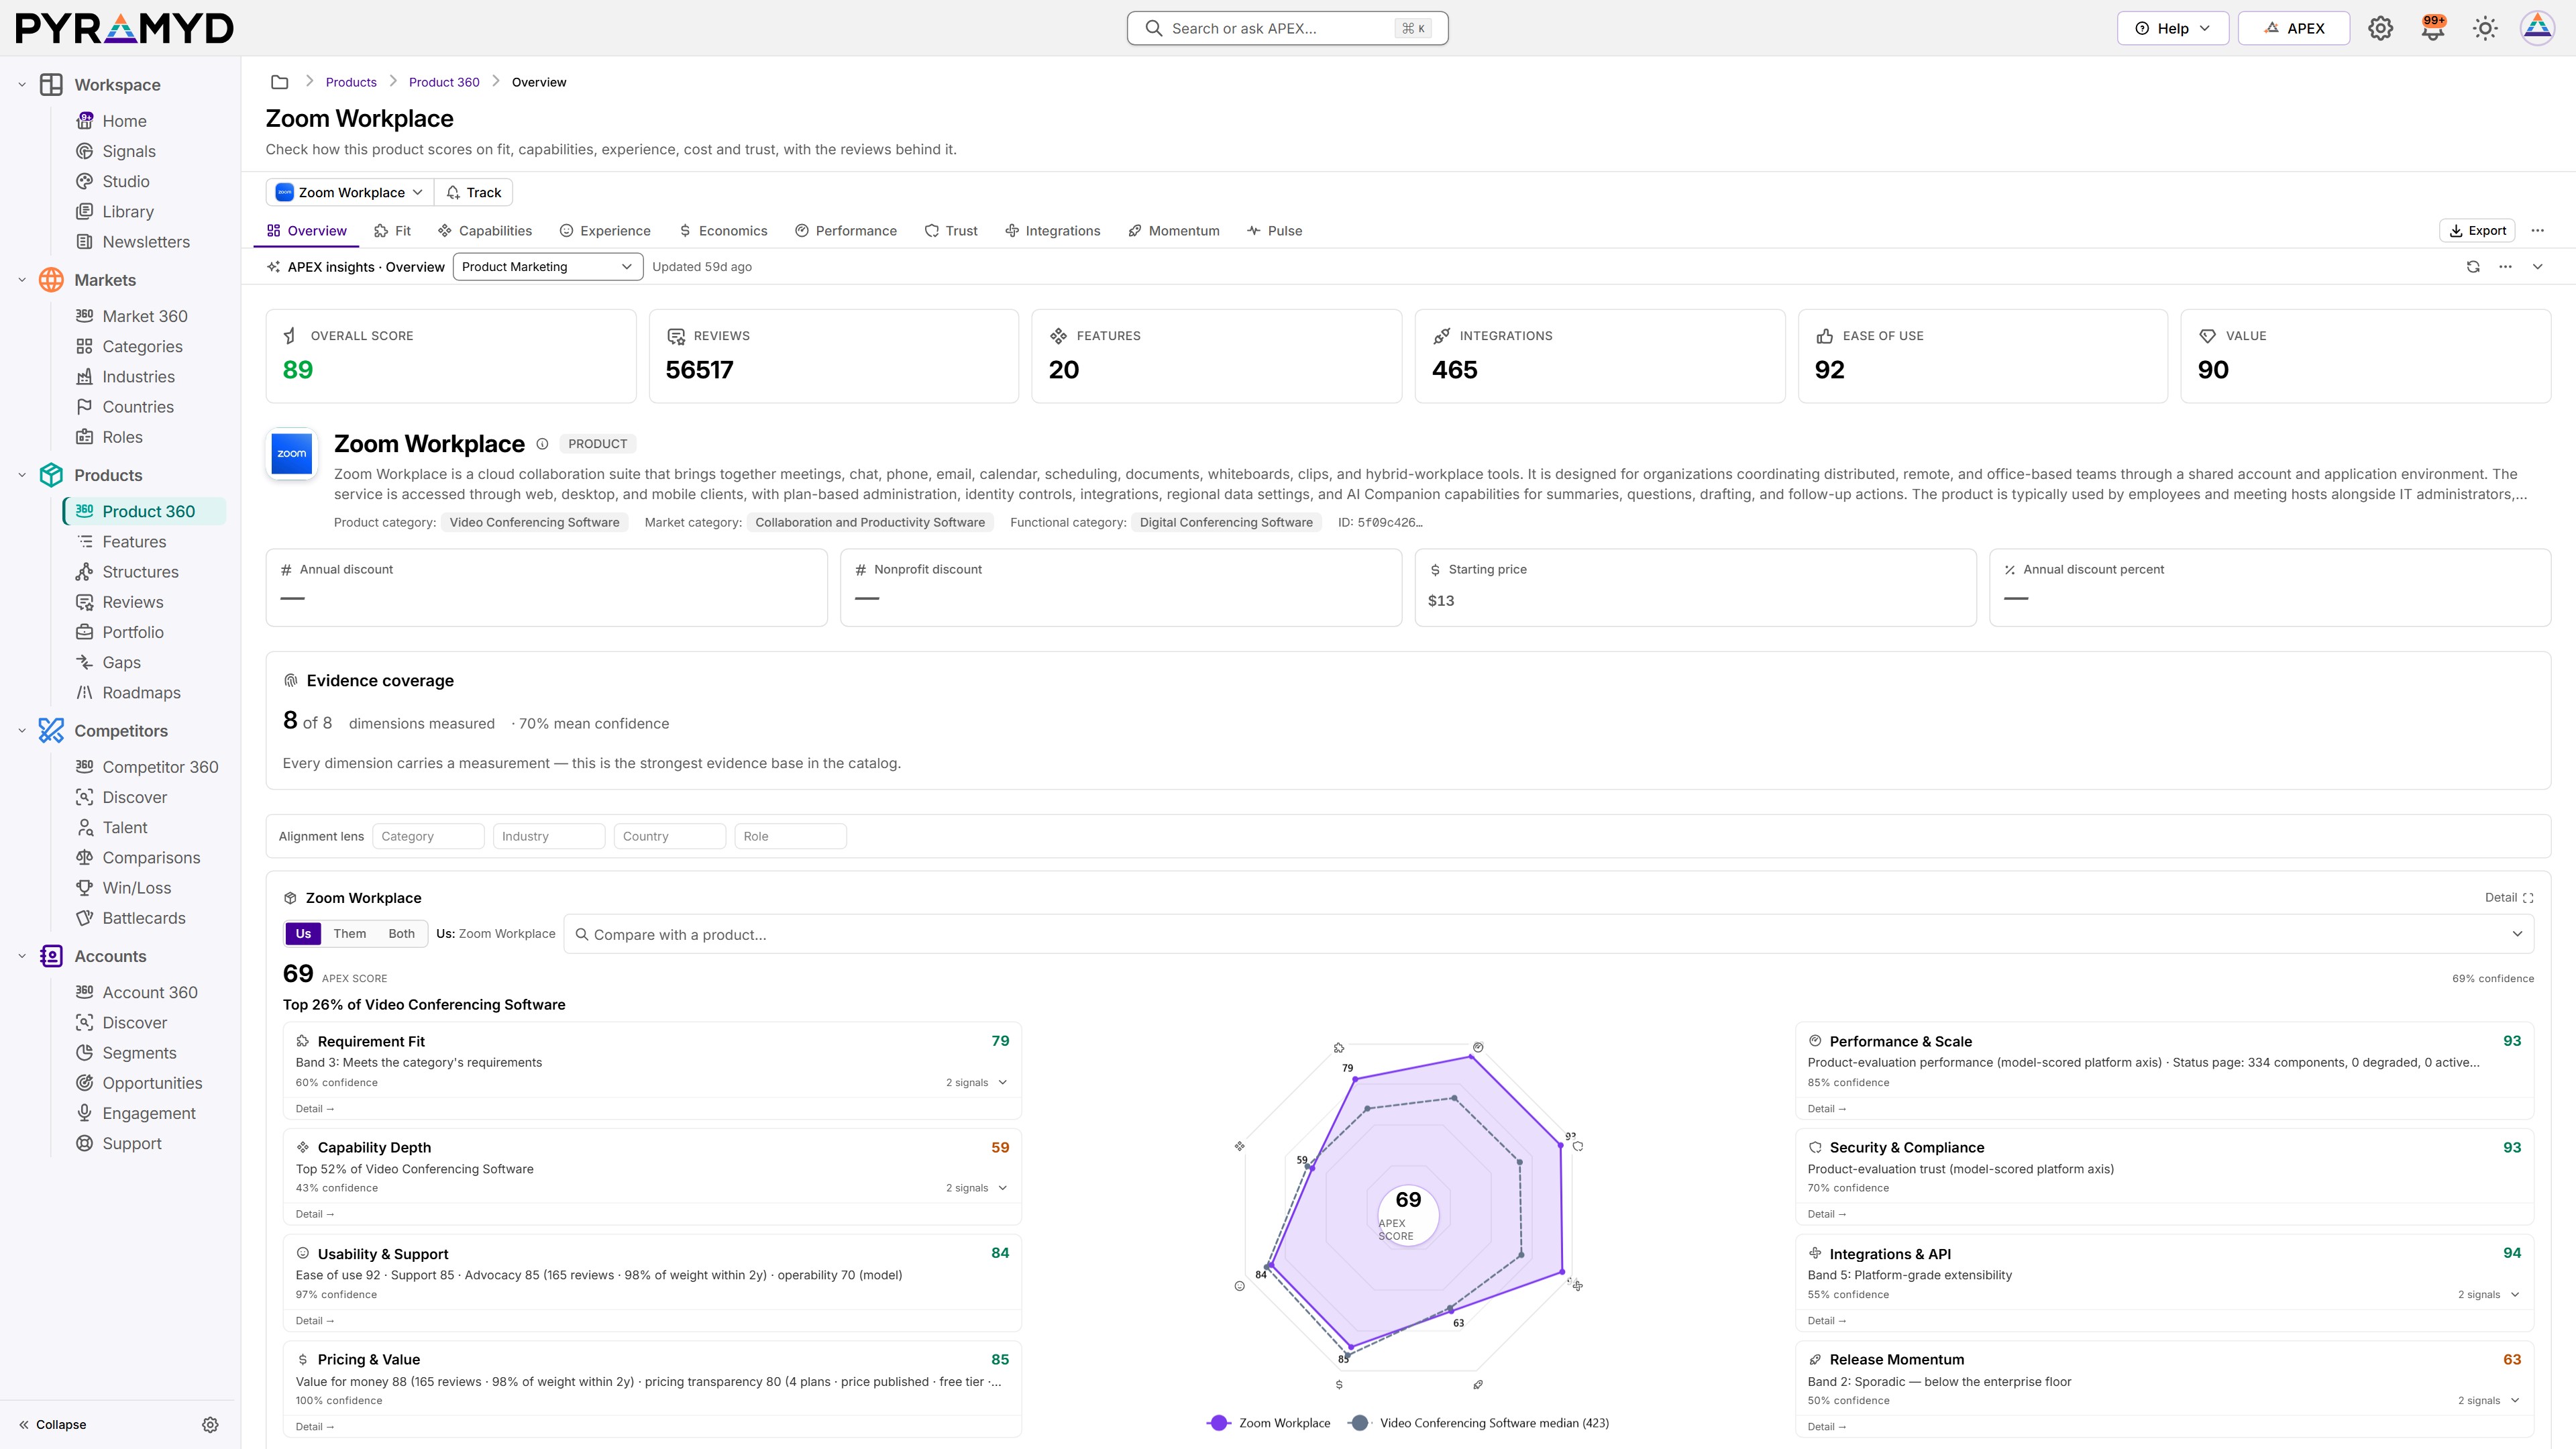
Product 360 on Zoom Workplace: the score, the reviews behind it, and each dimension against the other products in its category. Captured from the live app on 9 November 2026.
3
Find out when, and for whom, your review score slipped
Product manager · Product
Contoso’s review score has dropped this year, and the product manager wants to know since when, and which buyers moved.
Open your product’s Experience tab.
Filter to verified reviews from the last 12 months.
See the score trend fall after the March release, split by buyer segment.
Export the summary for the release review.
Reviews by segment
Verified and incentive filters
Trend over time
Export
Reads about 2.4 million public reviews · production estimate, 3 Nov 2026
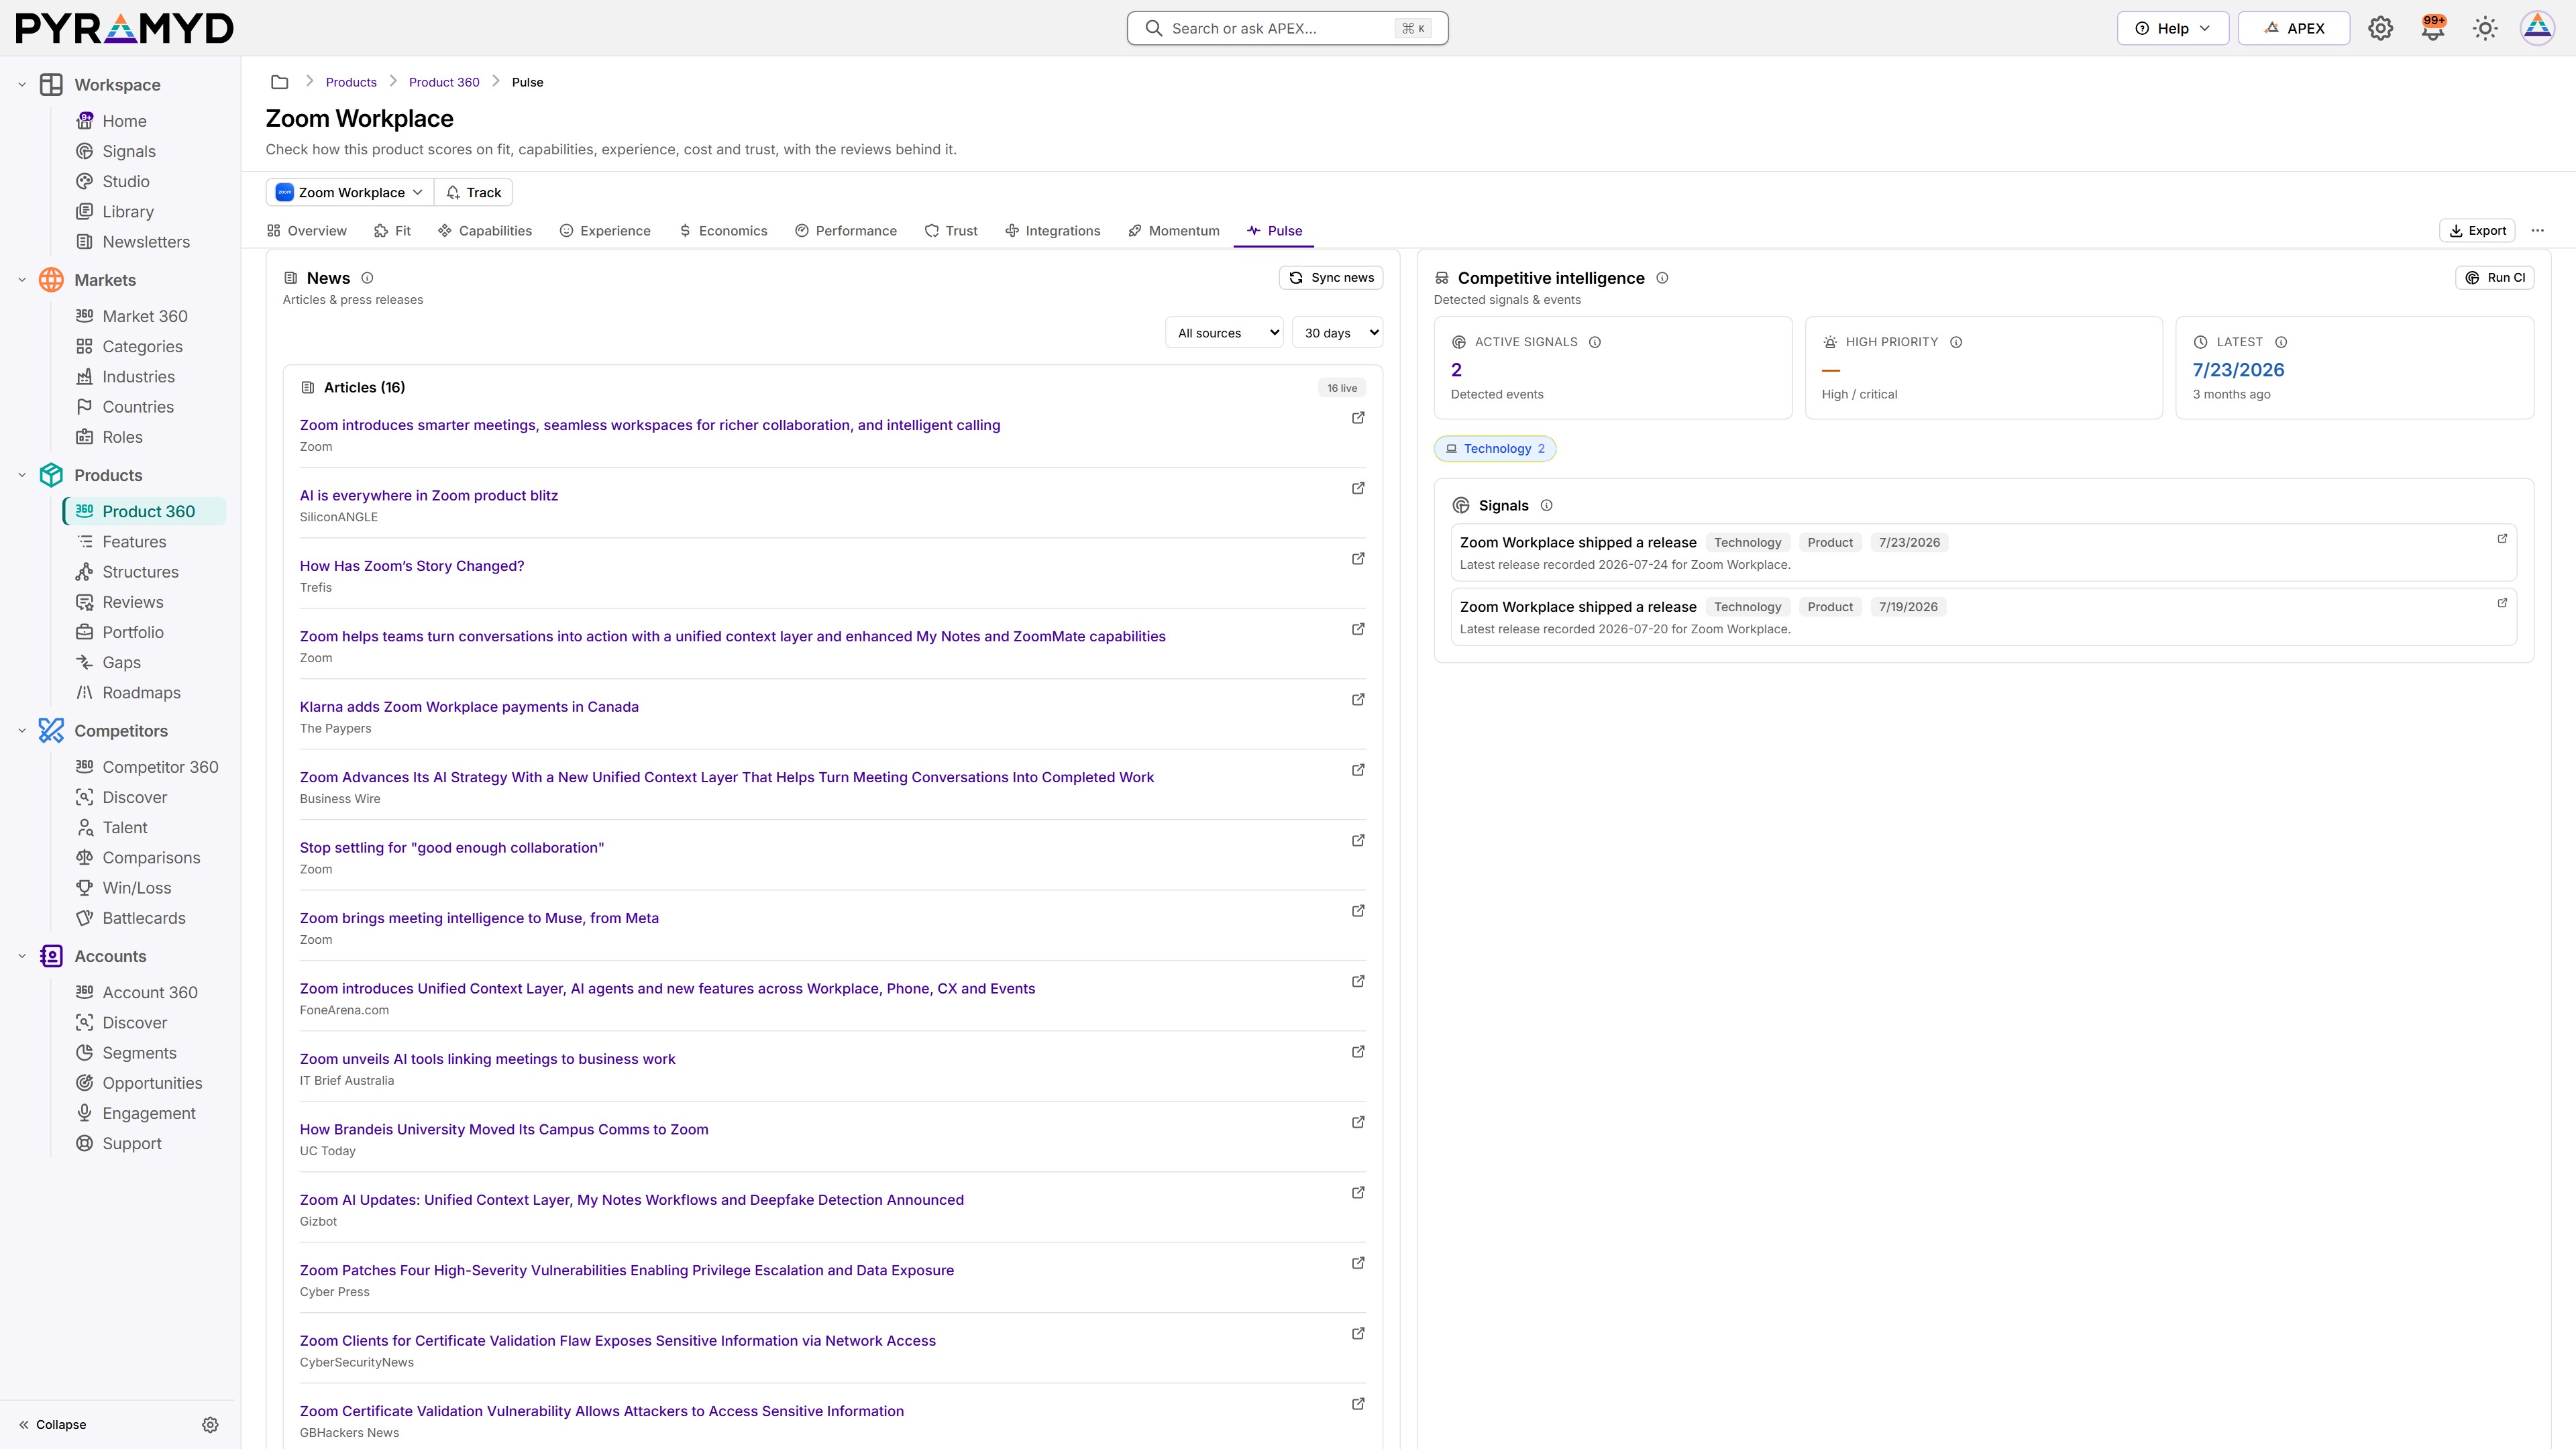
Pulse tab. The news about the product, each article with its source, beside the signals detected about it. Captured from the live app on 23 October 2026.
How it works
How Feature Market Fit is scored.
From one feature's criteria to Product Market Fit.
Converts measures, dimensions, locations, and time series from semantic models into charts, graphs, maps, and visual encodings.
ITS OWN CRITERIA criteria, 3 per dimension
Core18%
Usability14%
Flexibility16%
Data10%
Intelligence16%
Integration8%
Governance8%
Reliability10%
EVIDENCE, QUOTED
Core · Buyer reviewPartial
“map based data visualization where you can plot data based on Latitude & Longitude.”
Core · Buyer reviewPartial
“Visualization is a strength as well. … MSTR produced great graphs.”
Usability · Buyer reviewPartial
“Turning GIS data into an aesthetic map chart is simple now.”
Usability · Buyer reviewUnmet
“maps do not appear to scale properly…”
CRITERION BY CRITERION
Core
Turns model data into the right chart, graph, or mapPartial
Renders a visual on its own, context keptNot evidenced
Supports reading patterns, outliers, and trendsPartial
Usability
Measure, units, and legend clear from the visualNot evidenced
Direct controls to change form, range, and inspectPartial
Readable scales, colors, and labels by defaultUnmet
Met 100, partial 50, unmet 0. Six dimensions had no evidence: left open, never a zero.
feature score · confidence 22 32 of 100 points of weight evidenced
Core· weight %
Usability· weight %
Data· weight %
Integration· weight %
Flexibility· weight %
Intelligence· weight %
Governance· weight %
Reliability· weight %
FEATURE MARKET FITEXAMPLE
Eight dimension scores, weighted by what this feature has to do well: Core 18%, Flexibility and Intelligence 16% each.
A fully evidenced feature shows all eight. Each score traces back to its three criteria and their quotes.
THE MARKET LENSEXAMPLE
INDUSTRYHealthcare
COUNTRYGermany
ROLEIT and engineering
Governance weight8% to 20%Integration weight8% to 16%Reliability weight10% to 14%
73 to 68fit for this buyer
ROLL IT UP
FEATURES IN THE CAPABILITY
Custom Reports50
Dashboards50
Data Visualization39
Real-Time Reportingnot scored
CAPABILITY MARKET FIT
Reporting & Analytics
mean of the 3 scored features
MODULE MARKET FIT
Platform
mean of its capabilities
PRODUCT MARKET FIT
MicroStrategy Analytics in BI Software
mean of its modules
Real scores for MicroStrategy Analytics from the 1 Sep 2026 scoring run, stored at each level. A capability, module, or product publishes a score only once enough of what sits below it is scored.
WHERE YOU SEE IT
Product 360
Capabilities tab
Opens the feature scorecard
Comparisons
Feature matrix
Opens the feature scorecard
Battlecards
Feature comparison card
Opens the feature scorecard
8 dimensions24 criteriaMet, partial, unmetThe quote behind each verdictWeighted by market
Narrated walkthrough, about 75 seconds. Turn on narration to hear it; the captions on the board carry the same words.
Read the six steps
One feature, its criteria. Feature Market Fit starts with one feature: here, Data Visualization in MicroStrategy Analytics. It carries its own criteria, three testable statements on each of eight dimensions, weighted for that feature.
Evidence and verdicts. An AI model reads the evidence and marks each criterion met, partial, or unmet, quoting its source. Code turns the verdicts into scores: Core 50 and Usability 25. Where nothing is evidenced, the dimension stays open instead of scoring zero.
Feature Market Fit. With evidence on every dimension, the eight scores form the feature's fit, weighted by what that feature has to do well.
Industry, country, role. Then PYRAMYD judges the same feature for a buyer's industry, country, and role, shifting the weights toward what that market demands, such as governance in healthcare or integration for IT teams.
Roll it up. Feature scores roll up: features into Capability Market Fit, capabilities into Module Market Fit, and modules into Product Market Fit.
Where you see it. You see it in Product 360, in Comparisons, and on every battlecard's feature card, down to the criterion and the quote behind each score.
The evidence behind every record
live software products to open
250,583
Production count, 3 Nov 2026
products scored on at least one of the eight dimensions
61,132
Production count, 3 Nov 2026
public reviews behind the Experience scores
2.4 million
About; production estimate, 3 Nov 2026
news articles, plus about 43,000 signals, feeding Pulse