
PYRAMYD
Solutions

Competition hub

GA

Competitive Matrix

Score vendor products against extracted requirements and taxonomy features on the same 10-dimension rubric as battlecards · review or AI signals.

4 top capabilitiesIn the Product Graph

What it is

Competitive Matrix.

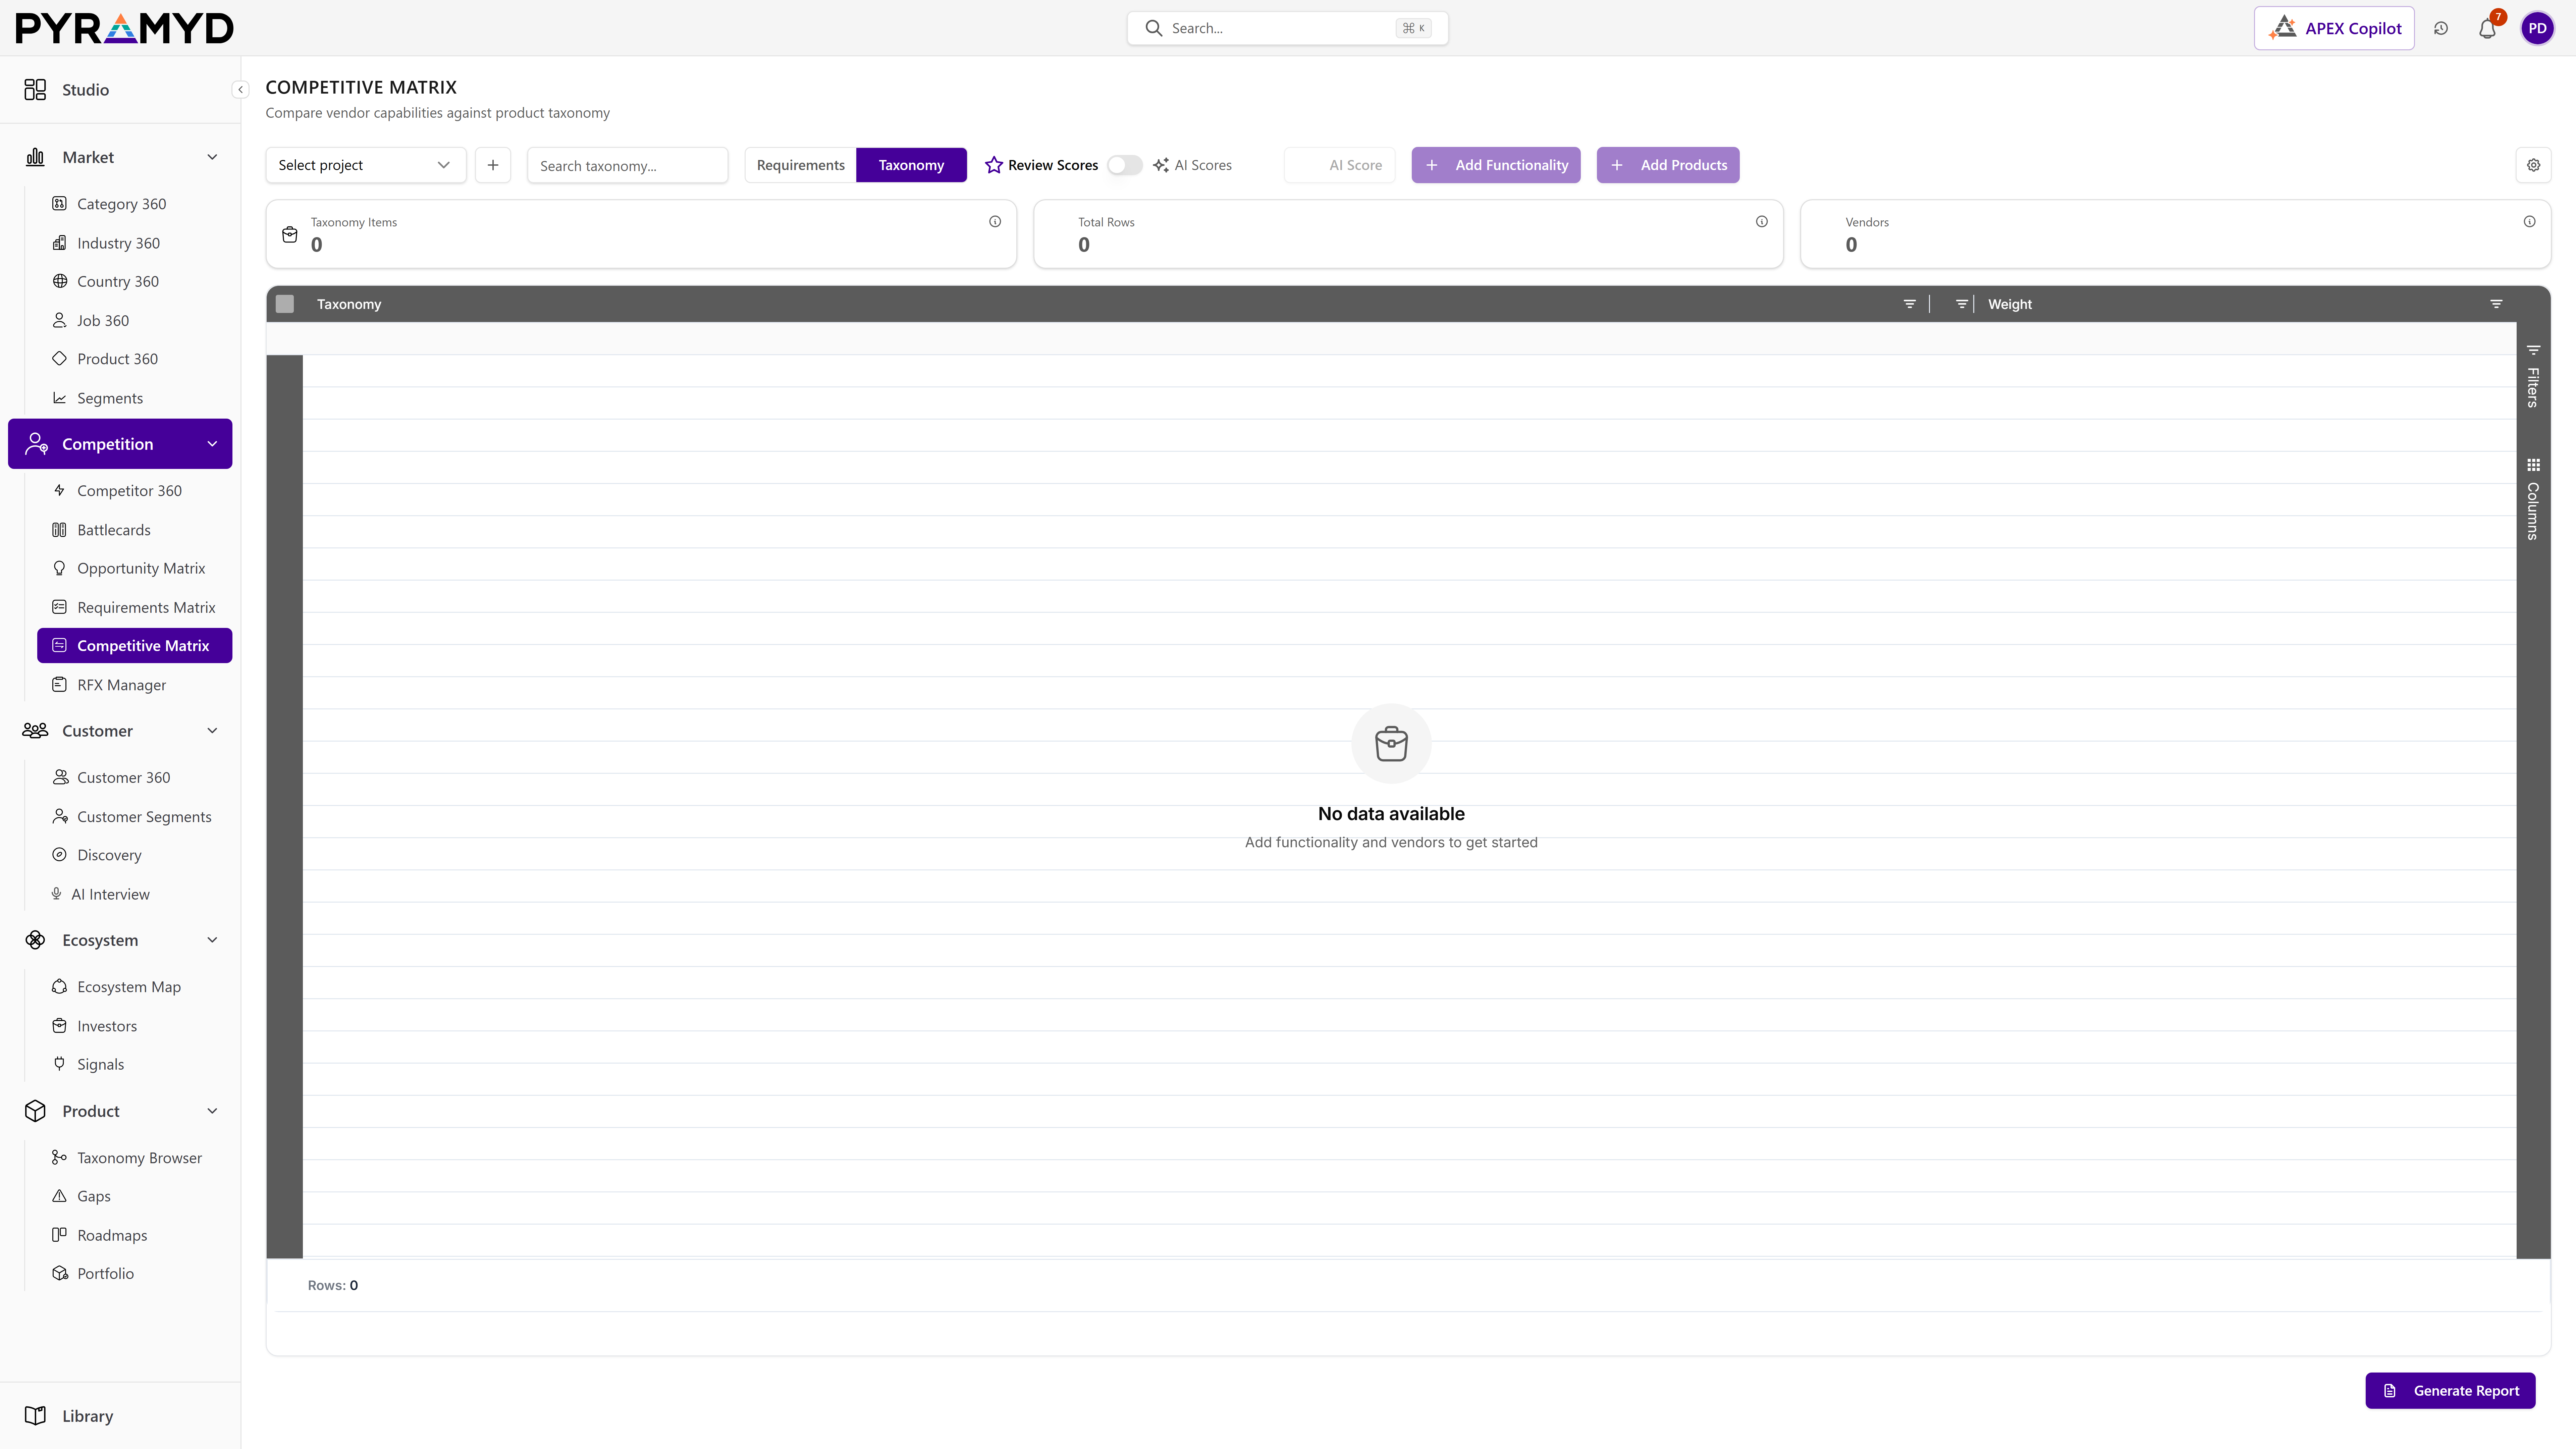
Competitive Matrix compares vendor products side by side against two sources of rows: requirements pulled from your sourcing documents and standard product-taxonomy features. It scores each vendor on every row using either aggregated customer reviews or a ten-dimension AI model. You manage the vendors under evaluation, the stakeholders, the priority weights, and any per-feature score overrides, and the matrix can suggest new vendors based on your active requirements and product context.

See it in the product

Competitive Matrix in the workspace.

Competitive Matrix screenshot from the production workspace

Top 4 capabilities

The most impactful capabilities.

Each capability is the parent of dozens of typed features in the production taxonomy. Hover any feature in Studio to drill into the underlying nodes.

01

Analyst charts reconstructed by measurement

Each report gets one method, stamped onto every vendor: a measured pixel centre mapped against the calibrated plot box where the analyst publishes no numbers, or the analyst's own weighted scorecard arithmetic where they do. Band boundaries come from a fixed per-framework template rather than being guessed per report.

02

Share a matrix the buyer can re-weight

A share link opens a guest view with the priority tiers exposed, so a buyer can weight the criteria the way they actually value them and watch the ranking change. Nothing persists back, so your evaluation is untouched, and every read re-validates the link's password, email and expiry gates.

03

Predict the next edition of the report

The ingested report's insights are fused with the platform's own competitive signals to produce per-vendor axis deltas, a predicted placement and the drivers behind each move — anchored to the same canonical scale the chart is plotted on, so a forecast and a measured position can be compared directly.

04

Vector export, not a screenshot

Both chart topologies are re-drawn as vector primitives for PPTX and PDF, taking their bands and labels from the same template the on-screen chart uses. A deck built this way stays legible when someone resizes it, which a pasted screenshot does not.

See Competitive Matrix running against your category.

30-minute walkthrough. We'll filter the workspace to your category and walk through the top capabilities live.