PYRAMYD
Solutions

Studio

GA

Studio Dashboard

Composable dashboards built from graph queries. Refresh as the graph refreshes.

5 top capabilities26 featuresFrom pyd_product_taxonomy

What it is

Studio Dashboard — in one paragraph.

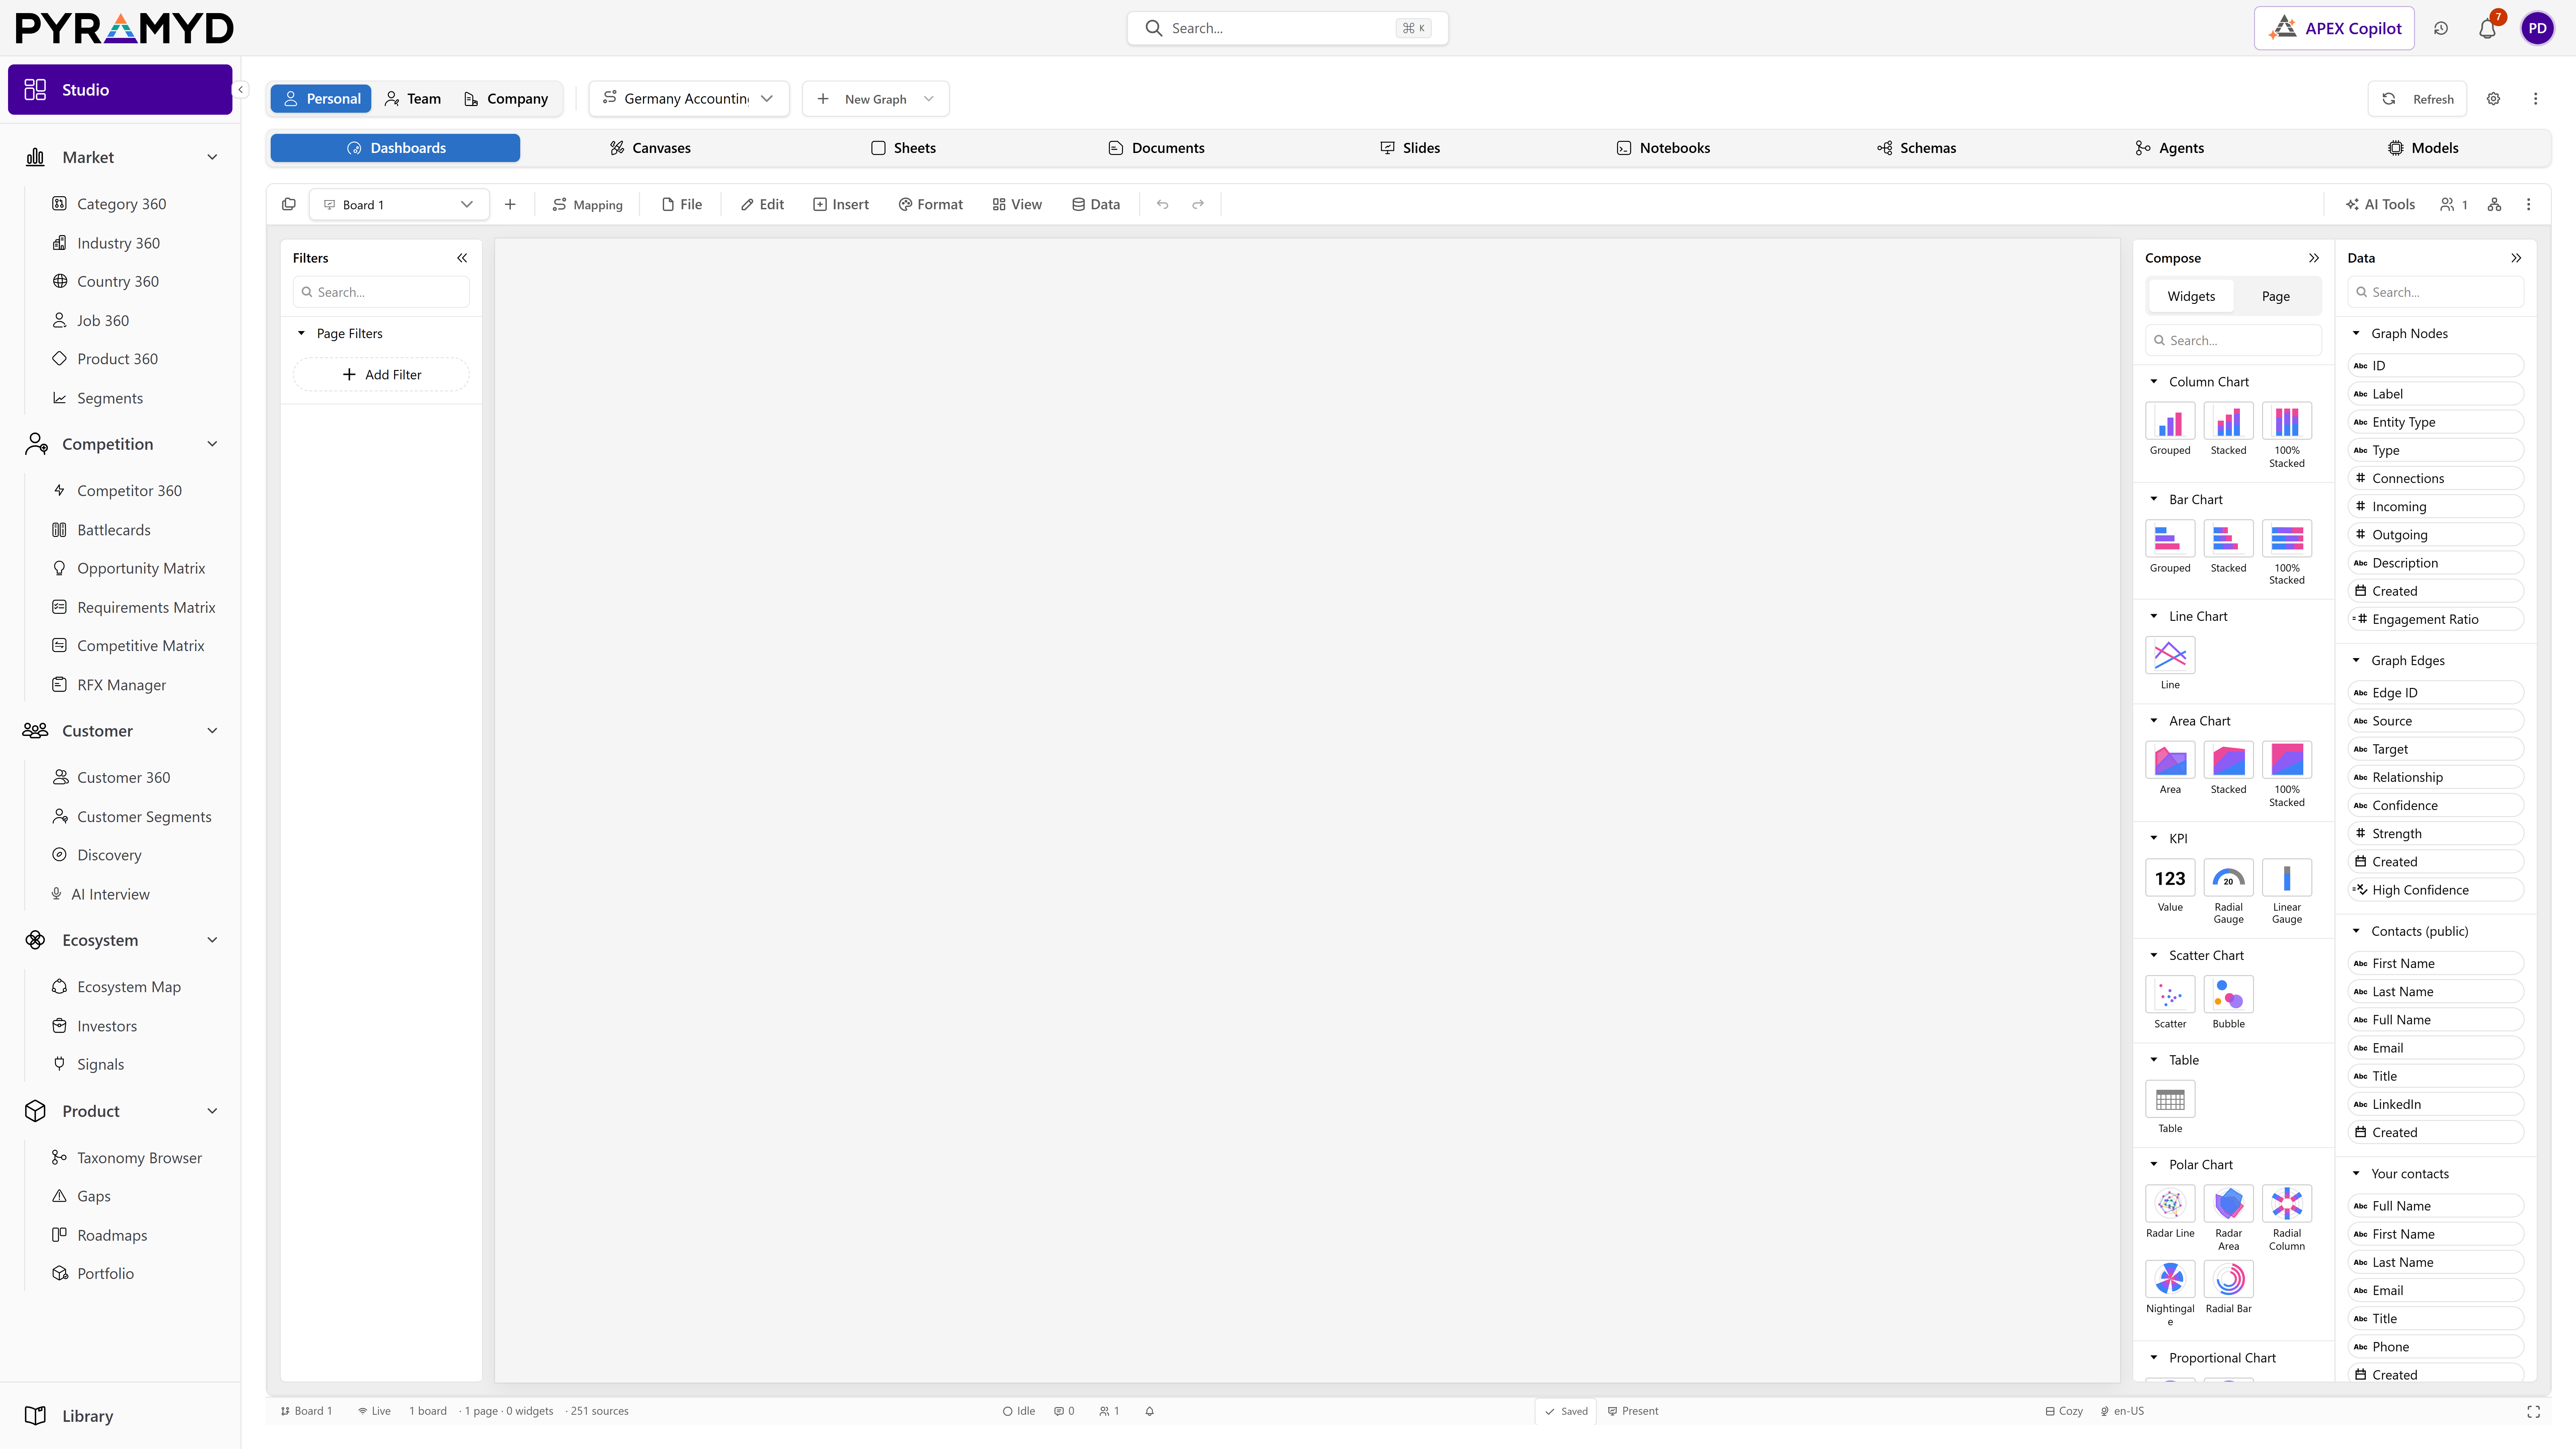
Studio Dashboard for Product Graph is the dashboard authoring and consumption surface. It provides a drag-and-drop canvas, 20 widget types covering charts (column, bar, line, area, pie, bubble, funnel, radar), grids and tables, gauges and KPI value tiles, text, image, filter widgets, geographic maps, and custom widgets such as heatmap, treemap, waterfall, and histogram, real-time collaboration via field-grained conflict-free replicated data types, an AI command bar with 16 tools for natural-language editing, multi-page layouts, public iframe embedding, and 9 export formats. State persists to local storage and backend services with optimistic concurrency and snapshot rollback.

Top 5 capabilities

The most-built-out capability set.

Each capability is the parent of dozens of typed features in the production taxonomy. Hover any feature in Studio to drill into the underlying nodes.

01

Custom Widget Types

7 features

Custom Widget Types for Product Graph ships 7 additional widgets registered via the dashboard runtime widget-types override: heatmap, treemap, waterfall, sankey, histogram, box-plot, and graph-embed. Each maps to a chart options builder that the underlying chart engine supports natively but the stock widget catalogue does not expose, and each integrates with the shared format and cross-filter systems so custom widgets behave like first-class catalogue widgets.

02

AI Command Bar

6 features

AI Command Bar for Product Graph accepts free-text prompts and translates them into a sequence of structured tool calls against the dashboard state. It bridges the supervisor AI to the dashboard runtime via a tool-call adapter, supports multi-turn conversations capped at 5 turns, surfaces incomplete-response signals, emits product-analytics telemetry per tool execution, and exposes a registry of 16 client-side tools spanning describe, navigate, mutate, and clear operations.

03

Data Pipeline

5 features

Data Pipeline for Product Graph wraps the dashboard runtime's data-engine API to manage the in-browser data layer that powers every widget binding. It accepts synchronous in-memory data sources, asynchronous lazy-loaded sources fetched on demand with field-level scoping, supports declared relationships (joins) between sources, calculated expression fields including measures and per-row columns, and pre-registered format definitions. The engine is created once per graph and reused across boards in that graph.

04

Widget Library

4 features

Widget Library for Product Graph covers every operation that mutates a widget's identity, type, data binding, layout, or visual style. It exposes 13 widget kinds spanning grid, value, gauge, text, image, filter widgets, and 21 chart types plus 7 custom widget types. Each widget instance is a single, well-understood slice of the dashboard state's pages-by-widgets map, addressable by a stable widget identifier that survives moves, renames, and cross-page relocation.

05

Real-time Collaboration

4 features

Real-time Collaboration for Product Graph synchronises the dashboard state across all clients connected to a single board's collaboration document. Two CRDT shapes are available behind a runtime flag: a single-blob last-write-wins shape and a field-grained shape with pages-map, page-order array, and panels-map split, which lets two users editing different pages converge without losing either party's changes. Awareness presence broadcasts each peer's focused page, widget selection, and color-coded avatar.

See Studio Dashboard running against your category.

30-minute walkthrough. We'll filter the workspace to your category and walk through the top capabilities live.